Regresion multivariada ecuacion normal, repaso breve.
Contents
Regresion multivariada ecuacion normal, repaso breve.
Supongamos que tenemos un conjunto de caracteristicas $X = X_1,X_2…X_j…X_n$ para realizar una predicción $y$ con valores esperados $\hat{y}$.
Cada X, puede ser escrito como: $X_1 = x_1^{(1)},x_1^{(2)}, x_1^{(3)}…x_1^{(m)}$,
$X_2 = x_2^{(1)},x_2^{(2)}, x_2^{(3)}…x_2^{(m)}$,
.
.
.
$X_n = x_n^{(1)},x_n^{(2)}, x_n^{(3)}…x_n^{(m)}$.
Siendo n el número de caracteristicas y m el número de datos de datos, $\hat{y} = \hat{y}_1^{(1)}, \hat{y}_1^{(2)}…\hat{y}_1^{(m)} $, el conjunto de datos etiquetados y $y = y_1^{(1)}, y_1^{(2)}…y_1^{(m)} $ los valores predichos por un modelo
Lo anterior puede ser resumido como:
Training |
$\hat{y}$ |
X_1 |
X_2 |
. |
. |
. |
. |
X_n |
|---|---|---|---|---|---|---|---|---|
1 |
$\hat{y}_1^{1}$ |
$x_1^{1}$ |
$x_2^{1}$ |
. |
. |
. |
. |
$x_n^{1}$ |
2 |
$\hat{y}_1^{2}$ |
$x_1^{2}$ |
$x_2^{2}$ |
. |
. |
. |
. |
$x_n^{2}$ |
. |
. |
. |
. |
. |
. |
. |
. |
|
. |
. |
. |
. |
. |
. |
. |
. |
|
. |
. |
. |
. |
. |
. |
. |
. |
|
m |
$\hat{y}_1^{m}$ |
$x_1^{m}$ |
$x_2^{m}$ |
. |
. |
. |
. |
$x_n^{m}$ |
y el el modelo puede ser ajustado como sigue:
Para un solo conjunto de datos de entrenamiento tentemos que:
$y = h(\theta_0,\theta_1,\theta_2,…,\theta_n ) = \theta_0 + \theta_1 x_1+\theta_2 x_2 + \theta_3 x_3 +…+ \theta_n x_n $.
Para todo el conjunto de datos, tenemos que:
Sea $\Theta^T = [\theta_0,\theta_1,\theta_2,…,\theta_n]$ una matrix $1 \times (n+1)$ y
luego $h = \Theta^{T} X $ con dimension $1\times m$
La anterior ecuación, es un hiperplano en $\mathbb{R}^n$. Notese que en caso de tener una sola característica, la ecuación puede ser análizada según lo visto en la sesión de regresion lineal.
Para la optimización, vamos a definir la función de coste $J(\theta_1,\theta_2,\theta_3, …,\theta_n )$ , como la función asociada a la minima distancia entre dos puntos, según la metrica euclidiana.
Metrica Eculidiana
Otras métricas pueden ser definidas como sigue en la siguiente referencia. Metricas.
Nuestro objetivo será encontrar los valores mínimos $\Theta = \theta_0,\theta_1,\theta_2,…,\theta_n$ que minimizan el error, respecto a los valores etiquetados y esperados $\hat{y}$
Para encontrar $\Theta$ optimo, se necesita minimizar la función de coste. Ecnontremos los valores exactos.
Normal equation
Se puede encontrar una solucion exacta para theta sin necesidad de emplear el gradiente descente de la sesiones pasadas, para ellos se puede encontrar el valor minimo de theta y a partir de alli determinar el valor de theta que minimiza J.
Los pasos para esta minimizacion se dejan como tarea, y pueden ser calculados según lo siguiente:
Si J es la funcion de coste dada por:
Demostrar que:
$J(\theta_1,\theta_2,\theta_3, …,\theta_n ) = \frac{1}{2m} (\Theta ^ T X - y)^T (\Theta ^ T X - y)$
$ \nabla _{\theta} J = \frac{1}{m}( (X^T X) \Theta - X^T y)$
Para encontrar el valor minimo de \theta, $\nabla _{\theta} J = 0$,
$\Theta = (X^T X)^{-1} X^T y$
Para la demostracion anterior emplee las siguientes propiedades:
$z^T z= \sum_i z_i^2$
$a^T b = b^Ta$
$\nabla _x b^T x = b$
$\nabla _x x^T A x = 2Ax$
donde a, b, x son matrices, $\nabla_x$ es la derivada respecto al vector x, y A es una matriz simétrica
from sklearn.datasets import load_boston
import pandas as pd
import numpy as np
import matplotlib.pyplot as plt
from matplotlib import cm
#from matplotlib.ticker import LinearLocator
import numpy as np
# Regresion lineal  simple
N = 10
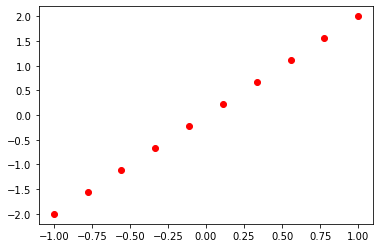
x1 = np.linspace(-1, 1, N)
y = 2*x1 #- 3*x2 + 0.0
df = pd.DataFrame({"Y":y, "X1":x1})
df["ones"] = np.ones(N)
plt.plot(df.X1,df.Y,"ro")
[<matplotlib.lines.Line2D at 0x298320435b0>]
y = np.reshape(df.Y.values, (N,1))

X = df[["ones","X1"]].values
X = np.matrix(X)
theta = (X.T@X).I @ X.T @ y
theta = np.array(theta).flatten()
theta
array([-8.32667268e-17, 2.00000000e+00])
$\Theta = (X^T X)^{-1} X^T y$
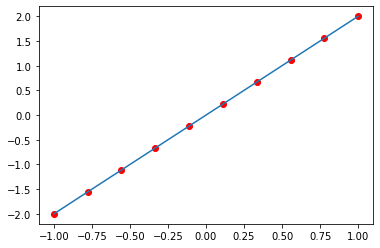
plt.plot(df.X1,df.Y,"ro")
x_ = np.linspace(-1, 1)
plt.plot(x_ ,theta[0] + theta[1]*x_ )
[<matplotlib.lines.Line2D at 0x29832bcf700>]
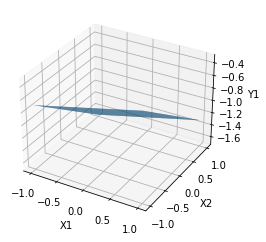
Modelo Bidimensional
N = 200
x1 = np.linspace(-1, 1, N)
x2 = np.linspace(-1, 1, N)

X1, X2 = np.meshgrid(x1,x2)
Y = 0.2*X1 - 0.5*X2 - 1.0
fig, ax = plt.subplots(subplot_kw={"projection": "3d"})
surf = ax.plot_surface(X1, X2, Y)
ax.set_xlabel("X1")
ax.set_ylabel("X2")
ax.set_zlabel("Y1")
#scatter = ax.scatter(x1, x2, y,"-")
Text(0.5, 0, 'Y1')
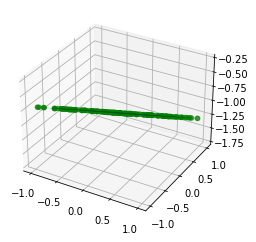
# Ecuaciones parametricas del mismo plano:
alpha = 2*np.random.random(N)-1
beta  = 2*np.random.random(N)-1
x1 = alpha
x2 = beta
y = 0.2*alpha - 0.5*beta - 1.0
fig, ax = plt.subplots(subplot_kw={"projection": "3d"})
surf = ax.scatter(x1, x2, y, color="green")
surf = ax.plot_surface(X1, X2, Y)
# Regresion bi-lineal
df = pd.DataFrame({"Y":y, "X1":x1,"X2":x2})
df["ones"] = np.ones(N)
y = np.reshape(df.Y.values, (N,1))
X = df[["ones","X1","X2"]].values
X = np.matrix(X)
theta = (X.T@X).I @ X.T @ y
theta = np.array(theta).flatten()
theta
array([-1. , 0.2, -0.5])
Datos de boston
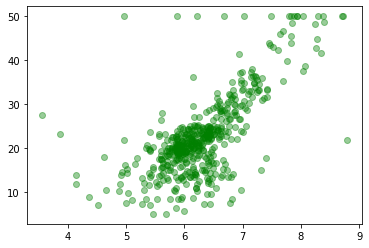
# Tomar los datos de las casas de boston y hacer una regresion lineal tomando
# el average number of rooms per dwelling.
data_url = "http://lib.stat.cmu.edu/datasets/boston"
raw_df = pd.read_csv(data_url, sep="\s+", skiprows=22, header=None)
data = np.hstack([raw_df.values[::2, :], raw_df.values[1::2, :2]])
target = raw_df.values[1::2, 2]
df = pd.DataFrame({"mean_":target, "rm":data[:,5]})
df["ones"] = np.ones(len(target))
df
| mean_ | rm | ones | |
|---|---|---|---|
| 0 | 24.0 | 6.575 | 1.0 |
| 1 | 21.6 | 6.421 | 1.0 |
| 2 | 34.7 | 7.185 | 1.0 |
| 3 | 33.4 | 6.998 | 1.0 |
| 4 | 36.2 | 7.147 | 1.0 |
| ... | ... | ... | ... |
| 501 | 22.4 | 6.593 | 1.0 |
| 502 | 20.6 | 6.120 | 1.0 |
| 503 | 23.9 | 6.976 | 1.0 |
| 504 | 22.0 | 6.794 | 1.0 |
| 505 | 11.9 | 6.030 | 1.0 |
506 rows × 3 columns
plt.plot(df.rm, df.mean_,"go", alpha=0.4)
[<matplotlib.lines.Line2D at 0x29833d02aa0>]
X = df[["ones","rm"]].values
Y = np.reshape(df["mean_"].values,(len(X),1))
X = np.matrix(X)
theta = ((X.T@X).I)@X.T@Y
theta
matrix([[-34.67062078],
        [  9.10210898]])
theta = np.array(theta).flatten()
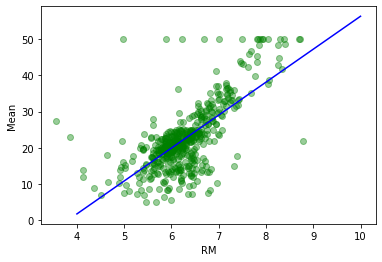
x = np.linspace(4, 10, 100)
plt.figure()
plt.plot(df.rm, df.mean_,"go", alpha=0.4)
plt.plot(x,theta[0]+theta[1]*x, "b-")
plt.ylabel("Mean")
plt.xlabel("RM")
Text(0.5, 0, 'RM')
Intepretación Probabilistica.
Supongamos que tenemos una caracteristica $x_i$ con m valores de entrenamiento, si asumimos que cada valor $y_i$ presenta una dispersión gaussiana $\epsilon_i$, cada $y_i$ podrá tener el siguiente valor:
$y^{i} = \Theta^T X^{(i)} + \epsilon_i$
Asumiendo ademas que el ruido gaussiando es aleatorio y esta distribuido de forma identica, con media cero y varianza $\sigma$, tenemos que la probabilidad de que la cantidad y tenga dispersion $\epsilon_i$ es:
Escribiendo, lo anterior en terminos de la probabilidad de obtener un valor de $y^{i}$ dado un $x^{i}$ parametrizado por $\theta$ obtenemos que:
Si ausmimos independicia estadística de cada $\epsilon^{(i)}$, la probabilidad $L(\theta)$ asociada a toda la distribución de puntos viene dada por:
para tener la mejor estimación posible de los valores que se deben elegir de $\theta$, se escogeran los parámetros que generan la mayor probabilidad de ocurrencia según las observaciones, es decir, aquellos valores para el cual $L(\theta)$ es máximo, si aplicamos el logaritmo natural antes de máximar tenemos que:
Después de un par de pasos se puede encontrar que:
maximar $\cal{l(\theta)}$ equivale a encontrar donde $\nabla_{\theta} \cal{l(\theta)} = 0$. Lo anterior muestra por que la elección de minimos cuadrados puede ser una buena eleccción para el analisis de los datos.
