Maquinas de soporte vectorial, (Support vector machine SVM)
Contents
Maquinas de soporte vectorial, (Support vector machine SVM)
Las maquinas de soporte vectorial se pueden definir como:
Clasfiicar lineal de orden maximo
Clasificador lineal en un espacio N-dimensional
Entendamos la intuición detras de estos dos conceptos.
Nuestra funcion de coste esta definda como sigue:
Si suponemos que $y=1$ y $y=0$ tenemos para estos dos casos que:
#Cost function
h = lambda z: 1/(1+np.exp(-z))
J1 = lambda z,y: -y*np.log(h(z))
J2 = lambda z,y: -(1-y)*np.log(1-h(z))

# Ref metricas
m1 = lambda z: z-1


#===================
z1 = np.linspace(-2, 10)
z2 = np.linspace(-10, 2)
plt.plot(z1,J1(z1,1), label="y=1")

plt.plot(z2,J2(z2,0), label="y=0")
plt.legend()
plt.xlabel("Z")
plt.ylabel("Cost function")
---------------------------------------------------------------------------
NameError                                 Traceback (most recent call last)
Input In [1], in <cell line: 12>()
      7 m1 = lambda z: z-1
     11 #===================
---> 12 z1 = np.linspace(-2, 10)
     13 z2 = np.linspace(-10, 2)
     14 plt.plot(z1,J1(z1,1), label="y=1")

NameError: name 'np' is not defined
Para $y = 1$ se cumple que para $Z=\theta^T X\geq 0$ la clasificacion será tipo 1
Para $y = 0$ se cumple que para $Z=\theta^T X < 0 $ la clasificación será tipo 0
Las métricas anteriores pueden ser definidas en términos de métricas que permitan clasificar en los siguiente intervalos, segun la curva roja y negra definida en la gráfica:
Para $y = 1$ se cumple que para $Z=\theta^T X\geq 1$ la clasificacion será tipo 1
Para $y = 0$ se cumple que para $Z=\theta^T X < 1 $ la clasificación será tipo 0
Si interpretamos la funcion $J(\theta)$ como:
$J(\theta)=A+\lambda B$, podemos rescribir la anterior expresión como:
$J(\theta)=C A’+B’$
Siendo $C=\frac{1}{\lambda}$, el inverso del parametros de regularación descrito en las sesiones anteriores.
Nuestro objetivo sera mínimizar la función $\min [J(\theta))] =\min[ C A’+B’]$,
El termino B’ de la anterior expresión puede ser expresado como sigue:
$B’ = \frac{1}{2}\sum_{j=1}^{n}\theta_j^2=\frac{1}{2} (\theta_1^2 + \theta_2^2+…+\theta_n^2)=\frac{1}{2}||\theta||^2$
Interpretacion geométrica
Supongamos que tenemos dos caracteristicas, en nuestro sistema, de esta manera tenemos que:
$\theta^T X= [\theta_1, \theta_2] [x1,x2]$
Continuar con los aspectos teóricos…
References [1] https://www.cienciadedatos.net/documentos/34_maquinas_de_vector_soporte_support_vector_machines
import numpy as np
import matplotlib.pylab as plt
from sklearn.datasets import make_moons
from sklearn.datasets import make_circles
from sklearn.datasets import make_blobs
from sklearn.datasets import make_classification
from sklearn.linear_model import LogisticRegression
from sklearn.svm import SVC
from sklearn.model_selection import GridSearchCV

# Libraries for draw contours
def make_meshgrid(x, y, h=0.02):
    """Create a mesh of points to plot in

    Parameters
    ----------
    x: data to base x-axis meshgrid on
    y: data to base y-axis meshgrid on
    h: stepsize for meshgrid, optional

    Returns
    -------
    xx, yy : ndarray
    """
    x_min, x_max = x.min() - 1, x.max() + 1
    y_min, y_max = y.min() - 1, y.max() + 1
    xx, yy = np.meshgrid(np.arange(x_min, x_max, h), np.arange(y_min, y_max, h))
    return xx, yy


def plot_contours(ax, clf, xx, yy, **params):
    """Plot the decision boundaries for a classifier.

    Parameters
    ----------
    ax: matplotlib axes object
    clf: a classifier
    xx: meshgrid ndarray
    yy: meshgrid ndarray
    params: dictionary of params to pass to contourf, optional
    """
    Z = clf.predict(np.c_[xx.ravel(), yy.ravel()])
    Z = Z.reshape(xx.shape)
    out = ax.contourf(xx, yy, Z, **params)
    return out


def plot_contoursExact(ax, xx, yy, **params):
    """Plot the decision boundaries for a classifier.

    Parameters
    ----------
    ax: matplotlib axes object
    clf: a classifier
    xx: meshgrid ndarray
    yy: meshgrid ndarray
    params: dictionary of params to pass to contourf, optional
    """
    Z = clf.predict(np.c_[xx.ravel(), yy.ravel()])
    Z = Z.reshape(xx.shape)
    out = ax.contourf(xx, yy, Z, **params)
    return out
# Dataset Toys References
# https://scikit-learn.org/stable/datasets/toy_dataset.html
# https://matplotlib.org/stable/gallery/subplots_axes_and_figures/subplots_demo.html
# Dataset sinteticos
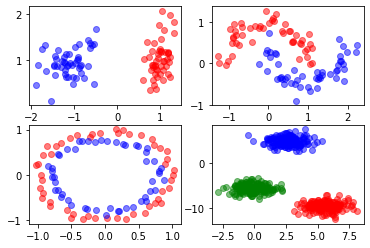
X0, y0 = make_classification(
    n_features=2, n_redundant=0, n_informative=2, random_state=1,
    n_clusters_per_class=1
)
X1, y1 = make_moons(n_samples=100, noise=0.15, shuffle=True,  random_state=1)
X2, y2 = make_circles(n_samples=100, noise=0.05, shuffle=True,  random_state=1)
X3, y3 = make_blobs(n_samples=500, centers=3, n_features=2,shuffle=True,
                    random_state=10)

fig, axs = plt.subplots(2,2)

axs[0, 0].plot(X0[:,0][y0==0],X0[:,1][y0==0],"ro", alpha=0.5)
axs[0, 0].plot(X0[:,0][y0==1],X0[:,1][y0==1],"bo", alpha=0.5)

# Dataset a moons
axs[0, 1].plot(X1[:,0][y1==0],X1[:,1][y1==0],"ro", alpha=0.5)
axs[0, 1].plot(X1[:,0][y1==1],X1[:,1][y1==1],"bo", alpha=0.5)

# Dataset circles
axs[1, 0].plot(X2[:,0][y2==0],X2[:,1][y2==0],"ro", alpha=0.5)
axs[1, 0].plot(X2[:,0][y2==1],X2[:,1][y2==1],"bo", alpha=0.5)

# Dataset circles
axs[1, 1].plot(X3[:,0][y3==0],X3[:,1][y3==0],"ro", alpha=0.5)
axs[1, 1].plot(X3[:,0][y3==1],X3[:,1][y3==1],"bo", alpha=0.5)
axs[1, 1].plot(X3[:,0][y3==2],X3[:,1][y3==2],"go", alpha=0.5)
[<matplotlib.lines.Line2D at 0x7f8a33581950>]
# Based on :
# https://rramosp.github.io/ai4eng.v1.20211.udea/content/NOTES%2003.03%20-%20SVM%20AND%20FEATURE%20TRANSFORMATION.html
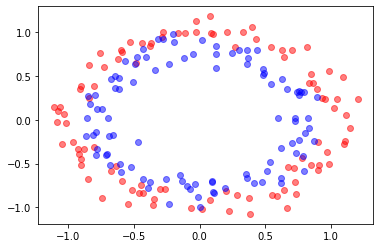
X, y = make_circles(n_samples=200, noise=0.1, shuffle=True,  random_state=1)

plt.plot(X[:,0][y==0],X[:,1][y==0],"ro", alpha=0.5)
plt.plot(X[:,0][y==1],X[:,1][y==1],"bo", alpha=0.5)
[<matplotlib.lines.Line2D at 0x7f8a34d03310>]
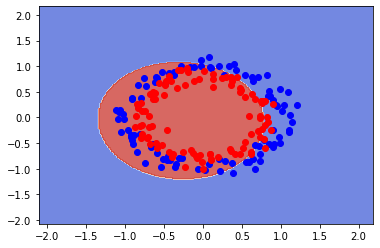
clf = SVC(gamma = 0.10) #Complexity of algorithm
clf.fit(X, y)

#Countour plot
fig, ax = plt.subplots()
X0, X1 = X[:, 0], X[:, 1]
xx, yy = make_meshgrid(X0, X1)
plot_contours(ax, clf, xx, yy, cmap=plt.cm.coolwarm, alpha=0.8)
plt.plot(X[y==0][:,0],X[y==0][:,1],"bo", alpha=1)
plt.plot(X[y==1][:,0],X[y==1][:,1],"ro", alpha=1)
print(f"Training error:{clf.score(X, y):.3f}")
Training error:0.635
Grid Search of parameter in SVM
Grid-search is used to find the optimal hyperparameters of a model which results in the most ‘accurate’ predictions. https://towardsdatascience.com/grid-search-for-model-tuning-3319b259367e
#https://scikit-learn.org/stable/modules/generated/sklearn.model_selection.GridSearchCV.html
from sklearn.model_selection import GridSearchCV


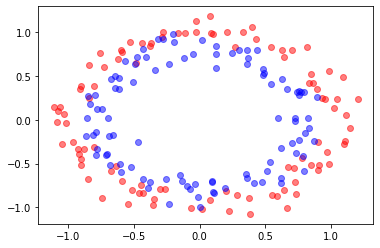
X, y = make_circles(n_samples=200, noise=0.1, shuffle=True,  random_state=1)

plt.plot(X[:,0][y==0],X[:,1][y==0],"ro", alpha=0.5)
plt.plot(X[:,0][y==1],X[:,1][y==1],"bo", alpha=0.5)
[<matplotlib.lines.Line2D at 0x7f8a349f4250>]
parameters = {'kernel':('linear', 'rbf'), 'C':[1, 10]}
parameters = {'C': [0.1,1, 10, 100], 'gamma': [1,0.1,0.01,0.001],'kernel': ['rbf', 'poly', 'sigmoid']}

clf = GridSearchCV(estimator=SVC(),
             param_grid = parameters)

clf.fit(X, y)
sorted(clf.cv_results_.keys())
['mean_fit_time',
 'mean_score_time',
 'mean_test_score',
 'param_C',
 'param_gamma',
 'param_kernel',
 'params',
 'rank_test_score',
 'split0_test_score',
 'split1_test_score',
 'split2_test_score',
 'split3_test_score',
 'split4_test_score',
 'std_fit_time',
 'std_score_time',
 'std_test_score']
clf.cv_results_
{'mean_fit_time': array([0.00206857, 0.00133414, 0.002145  , 0.00184765, 0.00131226,
        0.00177274, 0.00177774, 0.00132613, 0.00178552, 0.00216789,
        0.0015471 , 0.00219789, 0.00242796, 0.00140429, 0.00226235,
        0.00185962, 0.00131516, 0.0017982 , 0.00191288, 0.00132165,
        0.0017786 , 0.00210128, 0.00132256, 0.00177875, 0.00141177,
        0.00170116, 0.00228949, 0.00174408, 0.00135508, 0.00191026,
        0.00188537, 0.00132656, 0.00182943, 0.00191078, 0.00135727,
        0.00183592, 0.00172868, 0.00411572, 0.00180178, 0.00154214,
        0.00128736, 0.00196505, 0.00184169, 0.00172501, 0.00232635,
        0.00182514, 0.00139742, 0.00196843]),
 'mean_score_time': array([0.00094509, 0.00056295, 0.00075049, 0.00090499, 0.00057168,
        0.00067277, 0.00086918, 0.00056782, 0.00071511, 0.00105624,
        0.00064454, 0.00091519, 0.00112543, 0.00056086, 0.00075355,
        0.00091472, 0.00056481, 0.00069489, 0.00093093, 0.0005722 ,
        0.0006752 , 0.00095043, 0.00056782, 0.00070267, 0.000664  ,
        0.00056734, 0.00107045, 0.0008214 , 0.00061026, 0.00069866,
        0.00095572, 0.00059428, 0.00069923, 0.00090742, 0.00056558,
        0.00067677, 0.00058112, 0.00057974, 0.00058169, 0.00066299,
        0.0005559 , 0.00066509, 0.0008719 , 0.00080714, 0.00087495,
        0.00087662, 0.00057192, 0.00074143]),
 'mean_test_score': array([0.535, 0.545, 0.375, 0.45 , 0.555, 0.37 , 0.41 , 0.555, 0.37 ,
        0.37 , 0.555, 0.37 , 0.84 , 0.495, 0.485, 0.455, 0.555, 0.37 ,
        0.41 , 0.555, 0.37 , 0.37 , 0.555, 0.37 , 0.865, 0.485, 0.52 ,
        0.835, 0.555, 0.385, 0.42 , 0.555, 0.37 , 0.37 , 0.555, 0.37 ,
        0.845, 0.48 , 0.5  , 0.865, 0.545, 0.39 , 0.445, 0.555, 0.385,
        0.38 , 0.555, 0.37 ]),
 'param_C': masked_array(data=[0.1, 0.1, 0.1, 0.1, 0.1, 0.1, 0.1, 0.1, 0.1, 0.1, 0.1,
                    0.1, 1, 1, 1, 1, 1, 1, 1, 1, 1, 1, 1, 1, 10, 10, 10,
                    10, 10, 10, 10, 10, 10, 10, 10, 10, 100, 100, 100, 100,
                    100, 100, 100, 100, 100, 100, 100, 100],
              mask=[False, False, False, False, False, False, False, False,
                    False, False, False, False, False, False, False, False,
                    False, False, False, False, False, False, False, False,
                    False, False, False, False, False, False, False, False,
                    False, False, False, False, False, False, False, False,
                    False, False, False, False, False, False, False, False],
        fill_value='?',
             dtype=object),
 'param_gamma': masked_array(data=[1, 1, 1, 0.1, 0.1, 0.1, 0.01, 0.01, 0.01, 0.001, 0.001,
                    0.001, 1, 1, 1, 0.1, 0.1, 0.1, 0.01, 0.01, 0.01, 0.001,
                    0.001, 0.001, 1, 1, 1, 0.1, 0.1, 0.1, 0.01, 0.01, 0.01,
                    0.001, 0.001, 0.001, 1, 1, 1, 0.1, 0.1, 0.1, 0.01,
                    0.01, 0.01, 0.001, 0.001, 0.001],
              mask=[False, False, False, False, False, False, False, False,
                    False, False, False, False, False, False, False, False,
                    False, False, False, False, False, False, False, False,
                    False, False, False, False, False, False, False, False,
                    False, False, False, False, False, False, False, False,
                    False, False, False, False, False, False, False, False],
        fill_value='?',
             dtype=object),
 'param_kernel': masked_array(data=['rbf', 'poly', 'sigmoid', 'rbf', 'poly', 'sigmoid',
                    'rbf', 'poly', 'sigmoid', 'rbf', 'poly', 'sigmoid',
                    'rbf', 'poly', 'sigmoid', 'rbf', 'poly', 'sigmoid',
                    'rbf', 'poly', 'sigmoid', 'rbf', 'poly', 'sigmoid',
                    'rbf', 'poly', 'sigmoid', 'rbf', 'poly', 'sigmoid',
                    'rbf', 'poly', 'sigmoid', 'rbf', 'poly', 'sigmoid',
                    'rbf', 'poly', 'sigmoid', 'rbf', 'poly', 'sigmoid',
                    'rbf', 'poly', 'sigmoid', 'rbf', 'poly', 'sigmoid'],
              mask=[False, False, False, False, False, False, False, False,
                    False, False, False, False, False, False, False, False,
                    False, False, False, False, False, False, False, False,
                    False, False, False, False, False, False, False, False,
                    False, False, False, False, False, False, False, False,
                    False, False, False, False, False, False, False, False],
        fill_value='?',
             dtype=object),
 'params': [{'C': 0.1, 'gamma': 1, 'kernel': 'rbf'},
  {'C': 0.1, 'gamma': 1, 'kernel': 'poly'},
  {'C': 0.1, 'gamma': 1, 'kernel': 'sigmoid'},
  {'C': 0.1, 'gamma': 0.1, 'kernel': 'rbf'},
  {'C': 0.1, 'gamma': 0.1, 'kernel': 'poly'},
  {'C': 0.1, 'gamma': 0.1, 'kernel': 'sigmoid'},
  {'C': 0.1, 'gamma': 0.01, 'kernel': 'rbf'},
  {'C': 0.1, 'gamma': 0.01, 'kernel': 'poly'},
  {'C': 0.1, 'gamma': 0.01, 'kernel': 'sigmoid'},
  {'C': 0.1, 'gamma': 0.001, 'kernel': 'rbf'},
  {'C': 0.1, 'gamma': 0.001, 'kernel': 'poly'},
  {'C': 0.1, 'gamma': 0.001, 'kernel': 'sigmoid'},
  {'C': 1, 'gamma': 1, 'kernel': 'rbf'},
  {'C': 1, 'gamma': 1, 'kernel': 'poly'},
  {'C': 1, 'gamma': 1, 'kernel': 'sigmoid'},
  {'C': 1, 'gamma': 0.1, 'kernel': 'rbf'},
  {'C': 1, 'gamma': 0.1, 'kernel': 'poly'},
  {'C': 1, 'gamma': 0.1, 'kernel': 'sigmoid'},
  {'C': 1, 'gamma': 0.01, 'kernel': 'rbf'},
  {'C': 1, 'gamma': 0.01, 'kernel': 'poly'},
  {'C': 1, 'gamma': 0.01, 'kernel': 'sigmoid'},
  {'C': 1, 'gamma': 0.001, 'kernel': 'rbf'},
  {'C': 1, 'gamma': 0.001, 'kernel': 'poly'},
  {'C': 1, 'gamma': 0.001, 'kernel': 'sigmoid'},
  {'C': 10, 'gamma': 1, 'kernel': 'rbf'},
  {'C': 10, 'gamma': 1, 'kernel': 'poly'},
  {'C': 10, 'gamma': 1, 'kernel': 'sigmoid'},
  {'C': 10, 'gamma': 0.1, 'kernel': 'rbf'},
  {'C': 10, 'gamma': 0.1, 'kernel': 'poly'},
  {'C': 10, 'gamma': 0.1, 'kernel': 'sigmoid'},
  {'C': 10, 'gamma': 0.01, 'kernel': 'rbf'},
  {'C': 10, 'gamma': 0.01, 'kernel': 'poly'},
  {'C': 10, 'gamma': 0.01, 'kernel': 'sigmoid'},
  {'C': 10, 'gamma': 0.001, 'kernel': 'rbf'},
  {'C': 10, 'gamma': 0.001, 'kernel': 'poly'},
  {'C': 10, 'gamma': 0.001, 'kernel': 'sigmoid'},
  {'C': 100, 'gamma': 1, 'kernel': 'rbf'},
  {'C': 100, 'gamma': 1, 'kernel': 'poly'},
  {'C': 100, 'gamma': 1, 'kernel': 'sigmoid'},
  {'C': 100, 'gamma': 0.1, 'kernel': 'rbf'},
  {'C': 100, 'gamma': 0.1, 'kernel': 'poly'},
  {'C': 100, 'gamma': 0.1, 'kernel': 'sigmoid'},
  {'C': 100, 'gamma': 0.01, 'kernel': 'rbf'},
  {'C': 100, 'gamma': 0.01, 'kernel': 'poly'},
  {'C': 100, 'gamma': 0.01, 'kernel': 'sigmoid'},
  {'C': 100, 'gamma': 0.001, 'kernel': 'rbf'},
  {'C': 100, 'gamma': 0.001, 'kernel': 'poly'},
  {'C': 100, 'gamma': 0.001, 'kernel': 'sigmoid'}],
 'rank_test_score': array([19, 17, 36, 27,  6, 37, 30,  6, 37, 37,  6, 37,  4, 22, 23, 26,  6,
        37, 30,  6, 37, 37,  6, 37,  1, 23, 20,  5,  6, 33, 29,  6, 37, 37,
         6, 37,  3, 25, 21,  1, 17, 32, 28,  6, 33, 35,  6, 37],
       dtype=int32),
 'split0_test_score': array([0.275, 0.525, 0.25 , 0.3  , 0.575, 0.25 , 0.25 , 0.575, 0.25 ,
        0.25 , 0.575, 0.25 , 0.9  , 0.45 , 0.425, 0.275, 0.575, 0.25 ,
        0.25 , 0.575, 0.25 , 0.25 , 0.575, 0.25 , 0.9  , 0.325, 0.525,
        0.775, 0.575, 0.275, 0.275, 0.575, 0.25 , 0.25 , 0.575, 0.25 ,
        0.9  , 0.325, 0.525, 0.925, 0.525, 0.275, 0.3  , 0.575, 0.275,
        0.275, 0.575, 0.25 ]),
 'split1_test_score': array([0.55 , 0.5  , 0.4  , 0.375, 0.5  , 0.375, 0.375, 0.5  , 0.375,
        0.375, 0.5  , 0.375, 0.875, 0.45 , 0.525, 0.425, 0.5  , 0.375,
        0.375, 0.5  , 0.375, 0.375, 0.5  , 0.375, 0.875, 0.45 , 0.5  ,
        0.875, 0.5  , 0.4  , 0.375, 0.5  , 0.375, 0.375, 0.5  , 0.375,
        0.925, 0.45 , 0.45 , 0.875, 0.5  , 0.425, 0.4  , 0.5  , 0.4  ,
        0.375, 0.5  , 0.375]),
 'split2_test_score': array([0.475, 0.5  , 0.325, 0.375, 0.5  , 0.325, 0.325, 0.5  , 0.325,
        0.325, 0.5  , 0.325, 0.75 , 0.35 , 0.55 , 0.375, 0.5  , 0.325,
        0.325, 0.5  , 0.325, 0.325, 0.5  , 0.325, 0.725, 0.45 , 0.425,
        0.825, 0.5  , 0.325, 0.325, 0.5  , 0.325, 0.325, 0.5  , 0.325,
        0.7  , 0.45 , 0.45 , 0.75 , 0.5  , 0.325, 0.375, 0.5  , 0.325,
        0.325, 0.5  , 0.325]),
 'split3_test_score': array([0.825, 0.575, 0.5  , 0.775, 0.575, 0.525, 0.725, 0.575, 0.525,
        0.525, 0.575, 0.525, 0.825, 0.6  , 0.5  , 0.775, 0.575, 0.525,
        0.725, 0.575, 0.525, 0.525, 0.575, 0.525, 0.9  , 0.575, 0.6  ,
        0.85 , 0.575, 0.525, 0.725, 0.575, 0.525, 0.525, 0.575, 0.525,
        0.875, 0.575, 0.55 , 0.875, 0.575, 0.525, 0.725, 0.575, 0.525,
        0.525, 0.575, 0.525]),
 'split4_test_score': array([0.55 , 0.625, 0.4  , 0.425, 0.625, 0.375, 0.375, 0.625, 0.375,
        0.375, 0.625, 0.375, 0.85 , 0.625, 0.425, 0.425, 0.625, 0.375,
        0.375, 0.625, 0.375, 0.375, 0.625, 0.375, 0.925, 0.625, 0.55 ,
        0.85 , 0.625, 0.4  , 0.4  , 0.625, 0.375, 0.375, 0.625, 0.375,
        0.825, 0.6  , 0.525, 0.9  , 0.625, 0.4  , 0.425, 0.625, 0.4  ,
        0.4  , 0.625, 0.375]),
 'std_fit_time': array([4.98258060e-04, 1.15697184e-04, 1.47676399e-05, 1.12806470e-04,
        8.59894873e-06, 2.72885036e-05, 1.31710675e-05, 2.63568046e-05,
        1.13863282e-05, 3.79923829e-04, 1.28727929e-04, 5.16469799e-04,
        6.73457168e-04, 5.17707705e-05, 1.01321669e-04, 9.34947932e-05,
        1.71776574e-05, 1.83439199e-05, 2.41461900e-04, 3.17648715e-05,
        6.29172130e-06, 6.04826060e-04, 1.52411955e-05, 1.07617403e-05,
        5.03458753e-05, 1.07042816e-04, 4.28722759e-04, 4.31782300e-05,
        4.91000127e-05, 8.35848615e-05, 1.48630792e-04, 2.01651948e-05,
        5.04984734e-05, 1.35171400e-04, 6.12603815e-05, 1.14898621e-04,
        1.64422455e-04, 1.10184680e-03, 5.68245863e-05, 5.73778769e-05,
        1.86360992e-05, 1.79204831e-04, 4.44906189e-05, 4.23235499e-04,
        5.90832519e-04, 5.77625583e-05, 1.44899852e-04, 3.64501803e-04]),
 'std_score_time': array([7.28726689e-05, 2.07467458e-05, 1.40237152e-05, 4.36011199e-05,
        1.42823674e-05, 2.10492147e-05, 3.40338158e-05, 6.76806476e-06,
        4.20360015e-05, 2.09807613e-04, 3.96330570e-05, 2.02092150e-04,
        2.78411109e-04, 1.56454915e-05, 4.18777602e-05, 2.55290973e-05,
        1.34945758e-05, 2.43245847e-05, 1.14556949e-04, 1.96396717e-05,
        4.48328372e-06, 7.76288257e-05, 1.28202705e-05, 3.19076396e-05,
        3.48636122e-05, 1.71214423e-05, 5.96806583e-04, 2.63503337e-05,
        6.66796029e-05, 2.11935745e-05, 1.98559024e-05, 1.22544367e-05,
        6.48112743e-06, 4.05171314e-05, 1.60201674e-05, 9.61226127e-06,
        2.62072236e-05, 9.94819913e-06, 1.76947067e-05, 1.82270341e-05,
        2.07375378e-05, 1.36175209e-05, 3.87853611e-05, 1.93202954e-04,
        2.08876633e-04, 3.43803890e-05, 1.42105474e-05, 1.60986919e-04]),
 'std_test_score': array([0.17649363, 0.0484768 , 0.083666  , 0.16733201, 0.0484768 ,
        0.09      , 0.16401219, 0.0484768 , 0.09      , 0.09      ,
        0.0484768 , 0.09      , 0.05147815, 0.1029563 , 0.05147815,
        0.16911535, 0.0484768 , 0.09      , 0.16401219, 0.0484768 ,
        0.09      , 0.09      , 0.0484768 , 0.09      , 0.0717635 ,
        0.10559356, 0.05787918, 0.03391165, 0.0484768 , 0.08455767,
        0.1584298 , 0.0484768 , 0.09      , 0.09      , 0.0484768 ,
        0.09      , 0.07968689, 0.09924717, 0.041833  , 0.06041523,
        0.0484768 , 0.08602325, 0.14611639, 0.0484768 , 0.08455767,
        0.0842615 , 0.0484768 , 0.09      ])}
clf.best_estimator_
SVC(C=10, gamma=1)
clf.best_params_
{'C': 10, 'gamma': 1, 'kernel': 'rbf'}
clf.best_score_
0.865
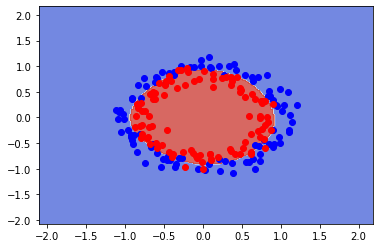
#Countour plot
fig, ax = plt.subplots()
X0, X1 = X[:, 0], X[:, 1]
xx, yy = make_meshgrid(X0, X1)
plot_contours(ax, clf, xx, yy, cmap=plt.cm.coolwarm, alpha=0.8)
plt.plot(X[y==0][:,0],X[y==0][:,1],"bo", alpha=1)
plt.plot(X[y==1][:,0],X[y==1][:,1],"ro", alpha=1)
print(f"Training error:{clf.score(X, y):.3f}")
Training error:0.885
Tarea 11.1
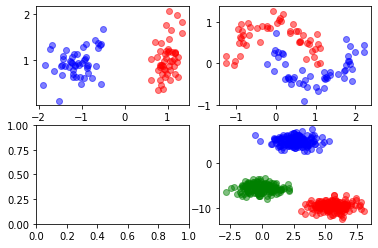
Implementar un SVM para clasificar los siguientes datasets, para ello se deberá crear un grid search.
Con los mejores párametros dibujar las fronteras de clasificación.
X0, y0 = make_classification(
    n_features=2, n_redundant=0, n_informative=2, random_state=1,
    n_clusters_per_class=1
)
X1, y1 = make_moons(n_samples=100, noise=0.15, shuffle=True,  random_state=1)
X3, y3 = make_blobs(n_samples=500, centers=3, n_features=2,shuffle=True, random_state=10)
# Dataset Toys References
# https://scikit-learn.org/stable/datasets/toy_dataset.html
# https://matplotlib.org/stable/gallery/subplots_axes_and_figures/subplots_demo.html
# Dataset sinteticos
X0, y0 = make_classification(
    n_features=2, n_redundant=0, n_informative=2, random_state=1,
    n_clusters_per_class=1
)
X1, y1 = make_moons(n_samples=100, noise=0.15, shuffle=True,  random_state=1)
X2, y2 = make_circles(n_samples=100, noise=0.05, shuffle=True,  random_state=1)
X3, y3 = make_blobs(n_samples=500, centers=3, n_features=2,shuffle=True,
                    random_state=10)

fig, axs = plt.subplots(2,2)

axs[0, 0].plot(X0[:,0][y0==0],X0[:,1][y0==0],"ro", alpha=0.5)
axs[0, 0].plot(X0[:,0][y0==1],X0[:,1][y0==1],"bo", alpha=0.5)

# Dataset a moons
axs[0, 1].plot(X1[:,0][y1==0],X1[:,1][y1==0],"ro", alpha=0.5)
axs[0, 1].plot(X1[:,0][y1==1],X1[:,1][y1==1],"bo", alpha=0.5)

# Dataset circles
axs[1, 1].plot(X3[:,0][y3==0],X3[:,1][y3==0],"ro", alpha=0.5)
axs[1, 1].plot(X3[:,0][y3==1],X3[:,1][y3==1],"bo", alpha=0.5)
axs[1, 1].plot(X3[:,0][y3==2],X3[:,1][y3==2],"go", alpha=0.5)
[<matplotlib.lines.Line2D at 0x7f8a333191d0>]
