Regresion multivariada
Contents
Regresion multivariada
Supongamos que tenemos un conjunto de caracteristicas $X = X_1,X_2…X_j…X_n$ para realizar una predicción $y$ con valores esperados $\hat{y}$.
Cada X, puede ser escrito como: $X_1 = x_1^{(1)},x_1^{(2)}, x_1^{(3)}…x_1^{(m)}$,
$X_2 = x_2^{(1)},x_2^{(2)}, x_2^{(3)}…x_2^{(m)}$,
.
.
.
$X_n = x_n^{(1)},x_n^{(2)}, x_n^{(3)}…x_n^{(m)}$.
Siendo n el número de caracteristicas y m el número de datos de datos, $\hat{y} = \hat{y}_1^{(1)}, \hat{y}_1^{(2)}…\hat{y}_1^{(m)} $, el conjunto de datos etiquetados y $y = y_1^{(1)}, y_1^{(2)}…y_1^{(m)} $ los valores predichos por un modelo
Lo anterior puede ser resumido como:
Training |
$\hat{y}$ |
X_1 |
X_2 |
. |
. |
. |
. |
X_n |
|---|---|---|---|---|---|---|---|---|
1 |
$\hat{y}_1^{1}$ |
$x_1^{1}$ |
$x_2^{1}$ |
. |
. |
. |
. |
$x_n^{1}$ |
2 |
$\hat{y}_1^{2}$ |
$x_1^{2}$ |
$x_2^{2}$ |
. |
. |
. |
. |
$x_n^{2}$ |
. |
. |
. |
. |
. |
. |
. |
. |
|
. |
. |
. |
. |
. |
. |
. |
. |
|
. |
. |
. |
. |
. |
. |
. |
. |
|
m |
$\hat{y}_1^{m}$ |
$x_1^{m}$ |
$x_2^{m}$ |
. |
. |
. |
. |
$x_n^{m}$ |
y el el modelo puede ser ajustado como sigue:
Para un solo conjunto de datos de entrenamiento tentemos que:
$y = h(\theta_0,\theta_1,\theta_2,…,\theta_n ) = \theta_0 + \theta_1 x_1+\theta_2 x_2 + \theta_3 x_3 +…+ \theta_n x_n $.
Para todo el conjunto de datos, tenemos que:
Sea $\Theta^T = [\theta_0,\theta_1,\theta_2,…,\theta_n]$ una matrix $1 \times (n+1)$ y
luego $h = \Theta^{T} X $ con dimension $1\times m$
La anterior ecuación, es un hiperplano en $\mathbb{R}^n$. Notese que en caso de tener una sola característica, la ecuación puede ser análizada según lo visto en la sesión de regresion lineal.
Para la optimización, vamos a definir la función de coste $J(\theta_1,\theta_2,\theta_3, …,\theta_n )$ , como la función asociada a la minima distancia entre dos puntos, según la metrica euclidiana.
Metrica Eculidiana
Otras métricas pueden ser definidas como sigue en la siguiente referencia. Metricas.
Nuestro objetivo será encontrar los valores mínimos $\Theta = \theta_0,\theta_1,\theta_2,…,\theta_n$ que minimizan el error, respecto a los valores etiquetados y esperados $\hat{y}$
Para encontrar $\Theta$ opmitimo, se necesita minimizar la función de coste, que permite obtener los valores más cercanos, esta minimización podrá ser realizada a través de diferentes metodos, el más conocido es el gradiente descendente.
Gradiente descendente
Consideremos la función de coste sin realizar el promedio esima de funcion de coste:
$\Lambda= [\Lambda_1,\Lambda_2, …,\Lambda_m]$
$J = \frac{1}{2m} \sum_{i}^m \Lambda_i $
El gradiente descente, puede ser escrito como:
escogiendo el valor j-esimo tenemos que:
Aplicando lo anterior a a funcion de coste asociada a la metrica ecuclidiana, tenemos que:
Para $j = 0$,
Para $0<j<n $
donde X_j es el vector de entrenamiento j-esimo.
Lo anterior puede ser generalizado como siguem, teniendo presente que $X_0 = \vec{1}$
Para $0\leq j<n$,
Modelos polinomiales
Otros modelos pueden ser ajustado. Consideremos una sola caracteristica, $y=h(\theta_0,\theta_1,\theta_2,…,\theta_n ) = \theta_0 + \theta_1 X_1$ En este caso el exponente de la variable X habla de la complejidad del modelo, para un solo dato entrenamiento podemos lo siguiente:
Lineal
$h_{\theta} = \theta_0 + \theta_1 x_1$
Orden 2
$h_{\theta} = \theta_0 + \theta_1 x_1 + \theta_2 x_1 ^2$
Orden 3
$h_{\theta} = \theta_0 + \theta_1 x_1 + \theta_2 x_1 ^2 + \theta_2 x_1 ^3$
from sklearn.datasets import load_boston
import pandas as pd
import numpy as np
import matplotlib.pyplot as plt
from matplotlib import cm
from matplotlib.ticker import LinearLocator
import numpy as np

#boston_dataset = load_boston()
#data_url = "http://lib.stat.cmu.edu/datasets/boston"
#raw_df = pd.read_csv(data_url, sep="\s+", skiprows=22, header=None)
#data = np.hstack([raw_df.values[::2, :], raw_df.values[1::2, :2]])
#target = raw_df.values[1::2, 2]
N=10
x1 = np.linspace(-1, 1, N)
x2 = np.linspace(-2, 2, N)
y = 2*x1 - 3*x2 + 0.0 #+ 4*np.random.random(100)
N = 10
X1,X2 = np.meshgrid(x1,x2)
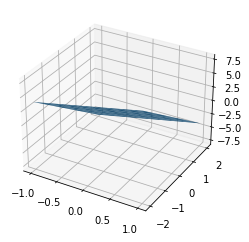
Y = 2*X1 - 3*X2 + 0.0
fig, ax = plt.subplots(subplot_kw={"projection": "3d"})
surf = ax.plot_surface(X1, X2, Y)
#scatter = ax.scatter(x1, x2, y,"-")
# Construccion del modelo para cualquier valor de Theta y X
# Generalizacion
def linearRegresion(Theta_, _X_, m_training, n_features) :
  m = m_training
  n = n_features
  shape_t = (n+1,1)
  shape_x = (n+1,m)

  if(shape_x != np.shape(_X_)):
    print(f"Revisar valores dimensiones Theta_ {_X_}")
    return 0

  if(shape_t != np.shape(Theta_)):
    print(f"Revisar valores dimensiones Theta_ {Theta_}")
    return 0
  else :
    return (Theta_.T@_X_)

def cost_function(h, y):
  J = (h-y)**2

  return J.mean()/2

def gradiente_D(h,Theta_, _X_, y,alpha, m_training, n_features):
  grad=((h-y)*_X_.T).mean(axis=1)
  theta=Theta_.T-alpha*grad
  return theta
N = 10
m_training=10
x1 = np.linspace(-1, 1, N)
x2 = np.linspace(-1, 1, N)
np.random.seed(30)
y = 2*x1 - 3*x2  + 4*np.random.random(N)

df = pd.DataFrame({"Y":y,"X1":x1, "X2":x2})
df["ones"] = np.ones(N)
X = df[["ones","X1","X2"]].values
#y = np.reshape(df.Y.values, (1,N))

#_X_ = np.matrix(X.T)
Theta = np.array([2.0, 4, 5])
Theta_ = np.reshape(Theta, (3, 1))
N = 10
X1,X2 = np.meshgrid(x1,x2)
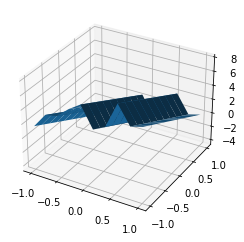
Y = 2*X1 - 3*X2  + 4*np.random.random(N)
fig, ax = plt.subplots(subplot_kw={"projection": "3d"})
surf = ax.plot_surface(X1, X2, Y)
#scatter = ax.scatter(x1, x2, y,"-")
cost=[]
t_=[]
for i in range(0, 1000):
  h = linearRegresion(Theta_, X.T, N, 2)
  J = cost_function(h,y)
  theta = gradD(h,Theta_, X,y, 0.1, N,2)
  Theta_ = theta.T
  t_.append(theta[:1])
  cost.append(J)
---------------------------------------------------------------------------
NameError                                 Traceback (most recent call last)
Input In [8], in <cell line: 3>()
      4 h = linearRegresion(Theta_, X.T, N, 2)
      5 J = cost_function(h,y)
----> 6 theta = gradD(h,Theta_, X,y, 0.1, N,2)
      7 Theta_ = theta.T
      8 t_.append(theta[:1])

NameError: name 'gradD' is not defined
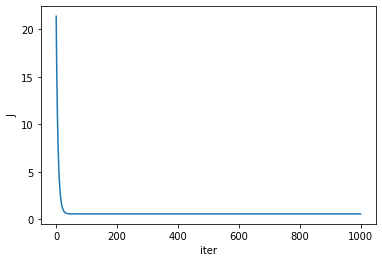
plt.plot(cost)
plt.ylabel("J")
plt.xlabel("iter")
Text(0.5, 0, 'iter')
Theta_=np.array(Theta_)
ymodelo = Theta_[0] + Theta_[1]*x1 + Theta_[2]*x2
ymodelo
array([3.25828205, 3.01244635, 2.76661066, 2.52077497, 2.27493927,
       2.02910358, 1.78326789, 1.53743219, 1.2915965 , 1.04576081])
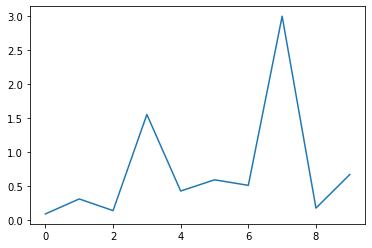
error = abs((y-ymodelo))/y
plt.plot(error)
[<matplotlib.lines.Line2D at 0x7ff33ffe5ed0>]
¿Qué sucede si las caracteristicas no estan escaladas?
Es recomendable escalar en función de :
$\mu_i$: es el promedio de los datos de la caracteristica i
$s_i$: es el rango de valores maximos o minimos o la desviacion estandar.
Si el rango de valores de la caracteristica xi esta entre [200,3000] y la media de valores es 2000, tenemos que
N = 10
m_training=10
x1 = np.linspace(-1, 1, N)
x2 = np.linspace(-2000, 2000, N)
np.random.seed(30)
y = 2*x1 - 3*x2  + 4*np.random.random(N)

df = pd.DataFrame({"Y":y,"X1":x1, "X2":x2})
df["ones"] = np.ones(N)
X = df[["ones","X1","X2"]].values
#y = np.reshape(df.Y.values, (1,N))

#_X_ = np.matrix(X.T)
Theta = np.array([2.0, 4, 5])
Theta_ = np.reshape(Theta, (3, 1))
cost=[]
t_=[]
for i in range(0, 1000):
  h = linearRegresion(Theta_, X.T, N, 2)
  J = cost_function(h,y)
  theta = gradD(h,Theta_, X,y, 0.1, N,2)
  Theta_ = theta.T
  t_.append(theta[:1])
  cost.append(J)
# NO hay convergencia
plt.plot(cost)
[<matplotlib.lines.Line2D at 0x7ff340057d50>]
N = 10
m_training=10
x1 = np.linspace(-1, 1, N)
x2 = np.linspace(-2000, 2000, N)
x2 =  (x2-np.mean(x2))/(max(x2)-min(x2))

np.random.seed(30)
y = 2*x1 - 3*x2  + 4*np.random.random(N)

df = pd.DataFrame({"Y":y,"X1":x1, "X2":x2})
df["ones"] = np.ones(N)
X = df[["ones","X1","X2"]].values
#y = np.reshape(df.Y.values, (1,N))

#_X_ = np.matrix(X.T)
Theta = np.array([2.0, 4, 5])
Theta_ = np.reshape(Theta, (3, 1))
cost=[]
t_=[]
for i in range(0, 1000):
  h = linearRegresion(Theta_, X.T, N, 2)
  J = cost_function(h,y)
  theta = gradD(h,Theta_, X,y, 0.1, N,2)
  Theta_ = theta.T
  t_.append(theta[:1])
  cost.append(J)

plt.plot(cost)
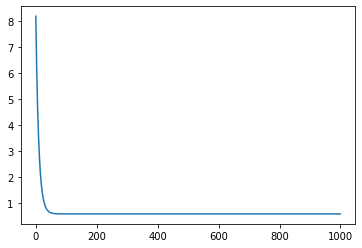
[<matplotlib.lines.Line2D at 0x7ff33fc2b5d0>]
